![]()
The Function Wizard is a convenient menu driven tool for accessing Excel's pre-defined data analysis functions. The steps are straightforward:
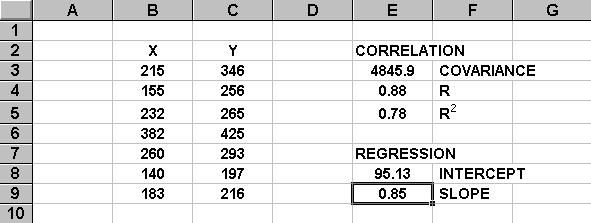
This example will demonstrate how to use the Function Wizard to compute the slope of a linear regression equation. The data for our independent variable (X) is located in cells B3:B9 and the data for the dependent variable (Y) is located in cells C3:C9. The slope of the regression equation should appear in cell E9.
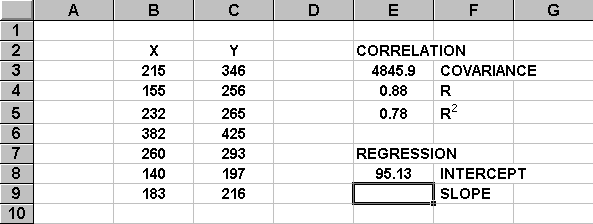
There are two ways to start the Function Wizard. The easiest is to simply press ![]() on the Excel button
bar. You can also start the Function Wizard by (1) selecting the Insert pull-down menu,
then (2) choosing the Function option.
on the Excel button
bar. You can also start the Function Wizard by (1) selecting the Insert pull-down menu,
then (2) choosing the Function option.
The Function Wizard's first dialog box allows us to choose the desired spreadsheet function from about a dozen major categories. The function names are presented in an alphabetic scroll list within each category. We can find the SLOPE function in either the ALL category or the STATISTICAL category of functions.
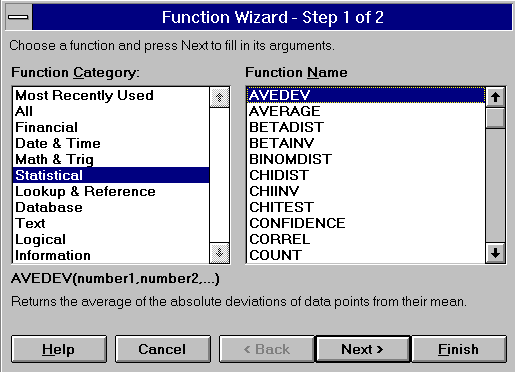
Scroll through the function list until SLOPE is found. Highlight it, then press the Next button.
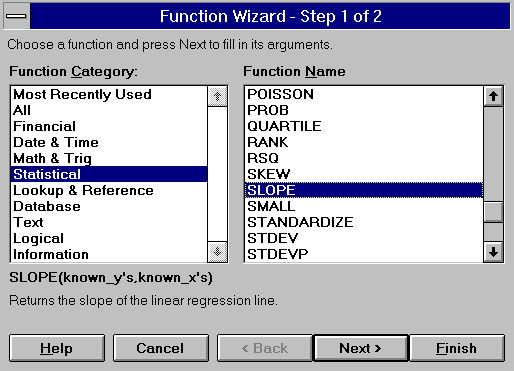
The second dialog box prompts us for the necessary data and/or parameters to complete the formula. If we need further instructions, then we can press the Help button.
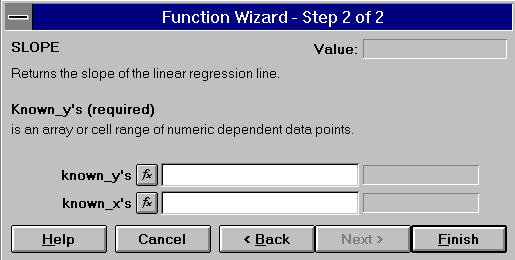
Our Y data values are located in cells C3:C9 and the X data values are located in cells B3:B9. We can either manually type these cell addresses in the appropriate locations on the dialog box, or we can use the mouse to point to the two data locations in our spreadsheet.
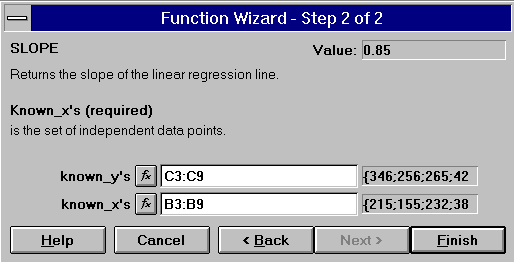
Press the Finish button after the data locations have been supplied. Excel puts the completed formula in cell E9. In this example, the slope of the regression equation is 0.85.
![]() Home | Lectures
| Handouts | Assignments |
Home | Lectures
| Handouts | Assignments |
 This website was originally developed by John Mote for his MIS 311F class. This site is
now maintained by the Department of Civil Engineering
at the University of Memphis. Your comments and questions are welcomed.