|
"The man who knows it all has lots to
learn" - Unknown
Objective
The purpose of this assignment is threefold. First, you will get a chance to practice
your skills in developing simple engineering spreadsheets. Second, you will be introduced
to the graphing and charting capabilities of Excel. And finally, you get
an opportunity to compute your current grade in the class. You must
hand in the cover sheet for the assignment and a printout of each graph for
Parts 1-3, and your calculations for Part 4. Also, submit your Excel file
for Parts 1-3 to the Dropbox in eCourseware.
Part 1: There are two basic steps in this part of the
assignment. Step 1 involves accessing information from the internet, Step 2
deals with spreadsheet graphs. The sample output shows the basic spreadsheet
layout you should achieve. Use the data you find on the web.
- The following links show the 300 most popular given names for male and
female babies born during the last 100 years, 1921-2020, according to Social
Security: Top 300 Female First Names or the
Top
300 Male First Names. Write down the top ten first names and their percentages. You
may want to browse the list for your name and add it to the top ten.
- Create a spreadsheet table showing the ten (or eleven) first names and their
percentages. The column of names should be left-justified,
and the column of numeric data (i.e., percentages) and its heading should be center justified. The numbers should appear with a percentage
sign and exactly three digits after the decimal point.
Use the data in your table to construct a bar chart. The chart should have a title
(e.g., Most Common Female Names). The bars should be labeled with the first names. The
vertical axis should show the percentages (any number of digits after the decimal point).
Note the following sample output.
Part 2: The life expectancy in the United States is
relatively high (77.8 years for males and 82.3 for females). The life expectancy is significantly
different in other countries. There are three basic steps to Part Two. Step 1 involves
accessing information from the internet, Step 2 deals with spreadsheet graphs, and step 3 involves using the built-in functions of your spreadsheet program. The sample
output shows the basic spreadsheet layout you should achieve. Do not use the data
in the sample output; use the data you find on the web.
- The CIA provides an excellent source
of information about countries
around the world - The
World Factbook. Examine their information about
Brazil,
Nigeria, Norway,
Japan, and one more country of your choice. Write down the male and female life expectancies for
these five countries. Scroll down on The World Facebook main page and choose
the region of the world where the country is located. Then, select the
country. Next, scroll down the page to find the life expectancies data listed in the People and Society section. You can also use the browser's Edit/Find feature to search for
"life expectancy."
- Create a spreadsheet table with the life expectancies for the five
countries. The column of country names should be left-justified, and the two
columns of numeric data and their headings should be center justified.
- Construct a paired bar chart showing the male and female life expectancies.
The chart should have a title (e.g., Life Expectancy). The horizontal axis
must be labeled with the country names (or abbreviations). A legend indicating
gender must also be included. The vertical axis should show the years. As
before, use the data found on the web, not the sample data shown below.
Use the data collected in Step 1 to compute the
mean,
median,
range,
mean absolute deviation, and
standard
deviation of the male and female life expectancies. Your statistics should be center justified with two digits after the decimal point. These statistics should be computed by the
spreadsheet program (i.e., not by hand).
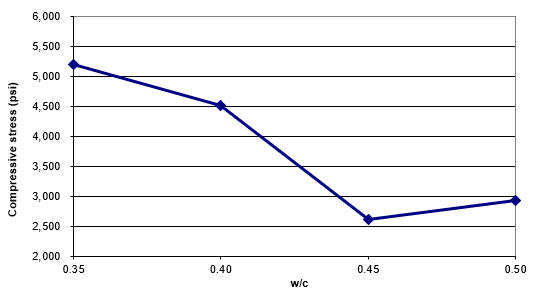
Part 3: Develop a graph of the relationship between
compressive failure stress and w/c. Use the data from the first lab (mix 1-2-2)
and only compute the average using strength values. Using an x-y scatter plot,
your graph should look similar to the one below.
Part 4: Compute your current grade in the
class using the information in the
class syllabus.
Part 5: Read Chapter 7 in the
Strategies for Creative Problem Solving by Fogler and LeBlanc
Coversheet for homework
This website was originally
developed by
Charles Camp for
CIVL
1101.
This site is
Maintained by the
Department of Civil Engineering
at the University of Memphis.
Your comments and questions are welcomed.
|