-
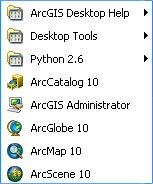
Start ArcGIS by clicking on Start
→
All Programs
→
ArcGIS
-
Click on ArcMap 10 to the the
program. It will take a few seconds for the
ArcMap to start. You should see the logo
while the program in loading.

-
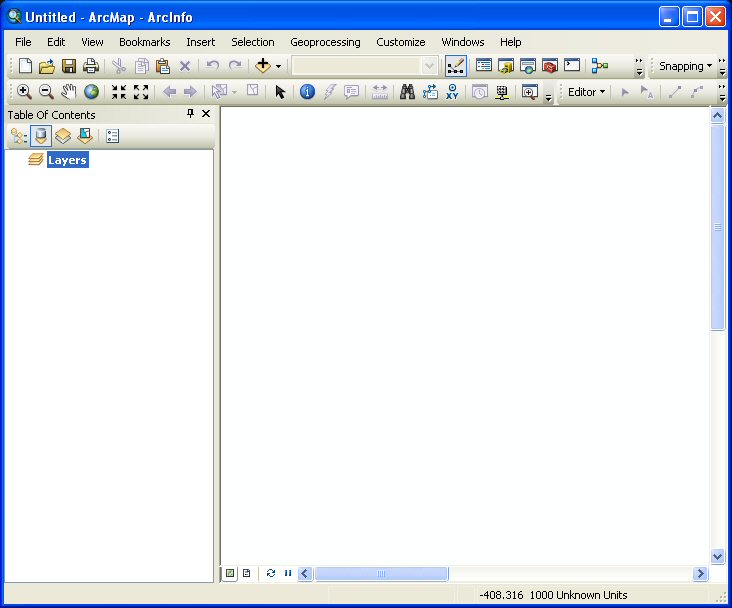
The main interface for
ArcMap should appear as shown below:
-
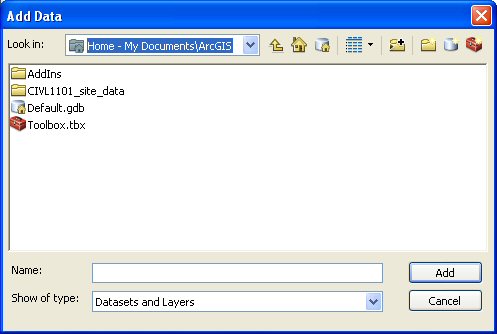
To add data to the
ArcMap project click on the Add data button
 at the top of the window. The following
window will appear:
at the top of the window. The following
window will appear:
-
If the "Look in" is not
My Documents\ArcGIS then click on the
pull-down menu and select My
Documents\ArcGIS. In general, we used
the My Documents\ArcGIS folder to store or
work.
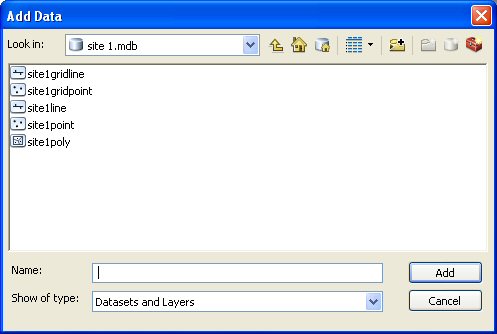
Next, click on the appropriate
data for your project. Depending on your site,
click on the the appropriate geodatabase
file. In this case, we are working a map of
Site #1. Click the site1.mdb file and the
following window will appear:
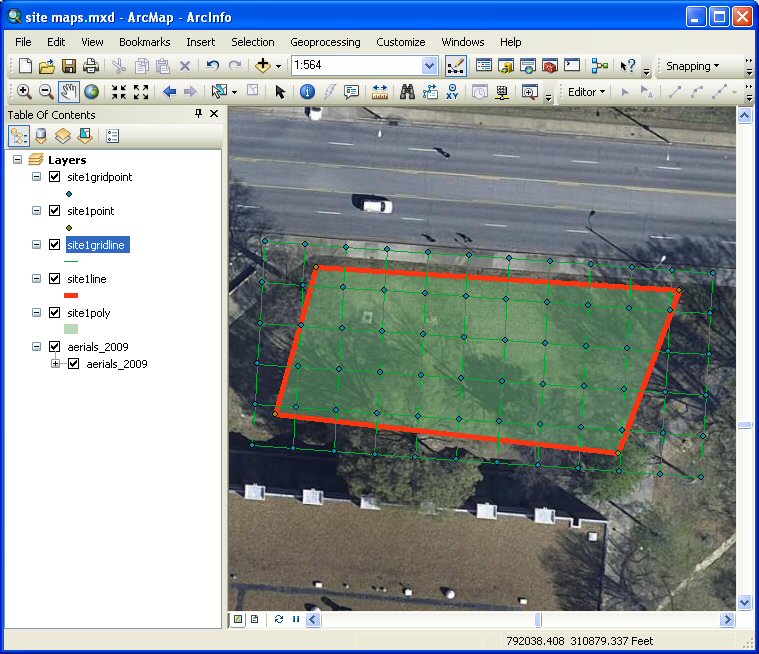
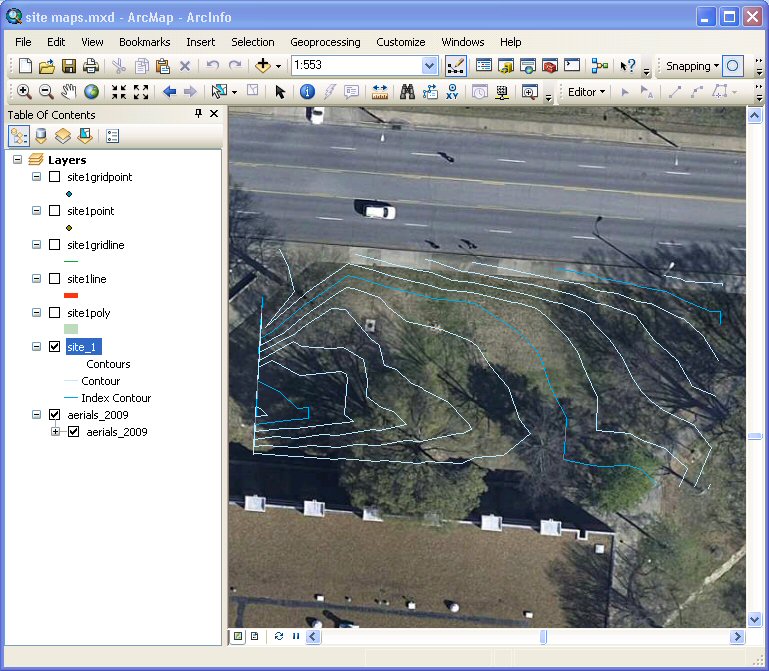
After the data is added, the map will appear
as shown below:
-
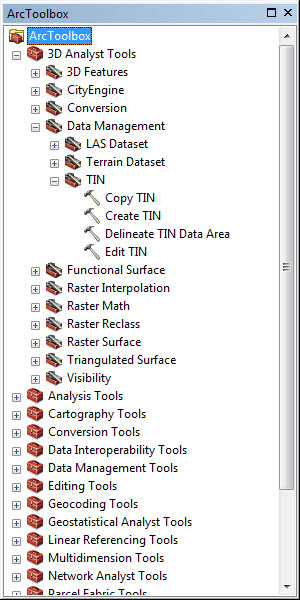
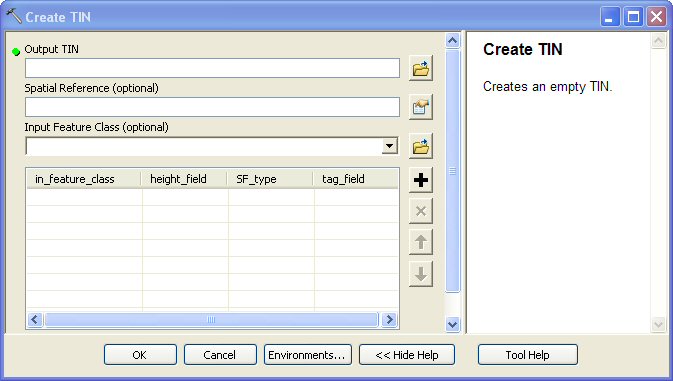
From ArcToolbox, expand 3D Analyst
and TIN
Management. Select Create TIN.
-
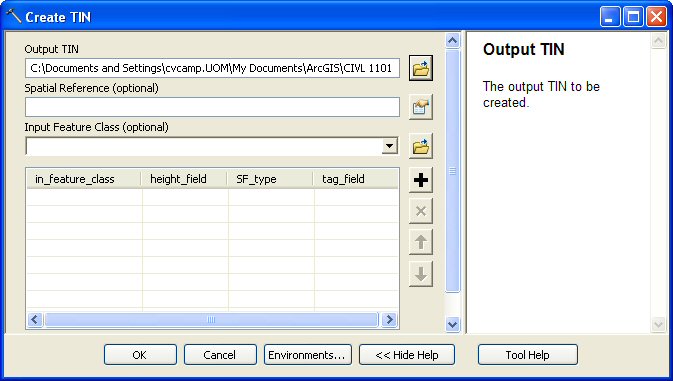
Define output TIN location. Click folder to
the right of the output field.
-
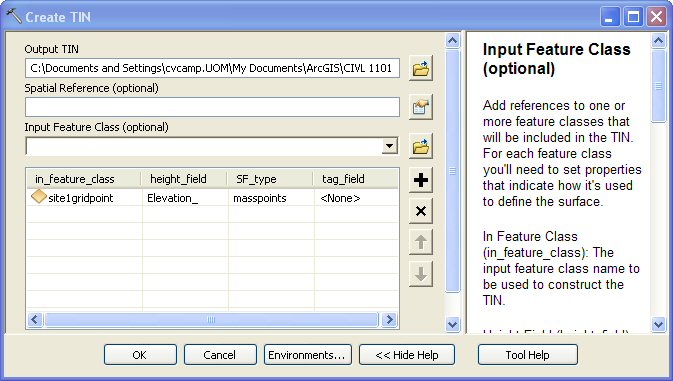
Define input feature class, in this case
site1gridpoint. This is the
feature class containing elevation data.
Check to make sure height field is the field
corresponding to elevation data.
-
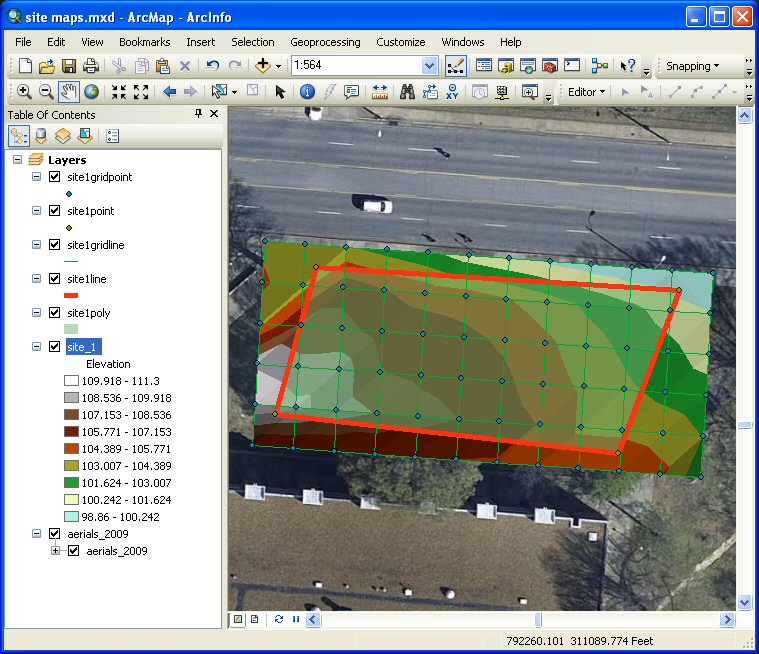
Click OK. TIN is created (may take some
time). The TIN is added to the current map
and an arbitrary color scheme is assigned.
-
To change the contour interval and the
symbology of the contour map
Right-Click on TIN (in table of contents) and
select properties and click Symbology tab.
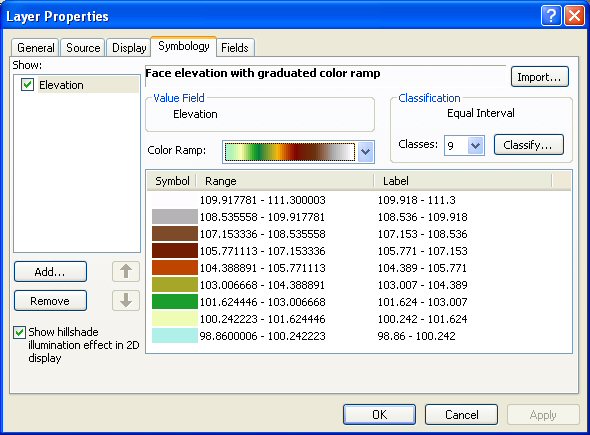
-
Click
Classify button and change Method to
Defined Interval.
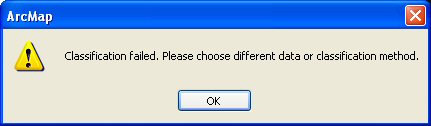
-
Click OK on error message.
-
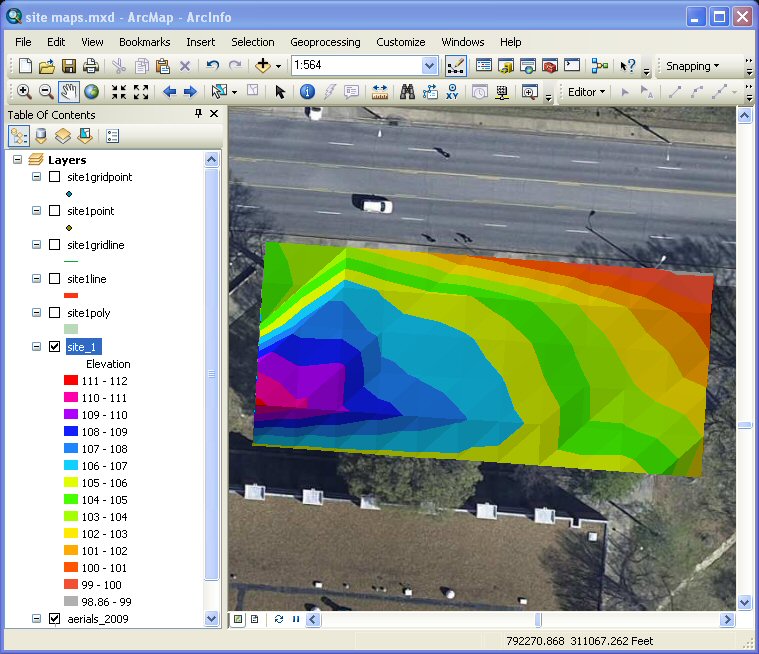
Change
Interval Size to desired contour
interval (in this case, 1 foot) and click OK
and then OK again; the following map
should appear.
-
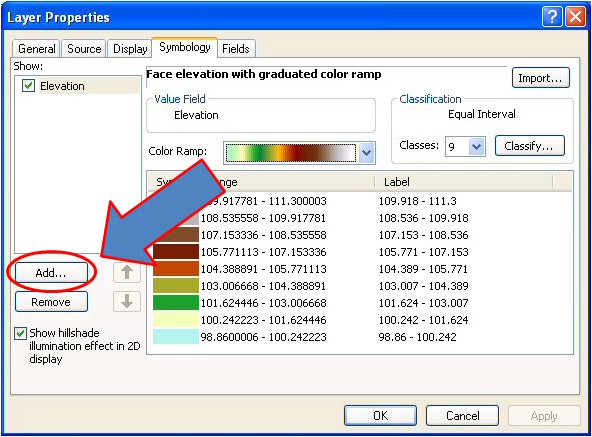
To change from a color-code surface map to a
contour map, Right-Click again on TIN (in
table of contents) and select properties and
click Symbology tab, then click the
Add button on the lower-left-hand
side of the window.
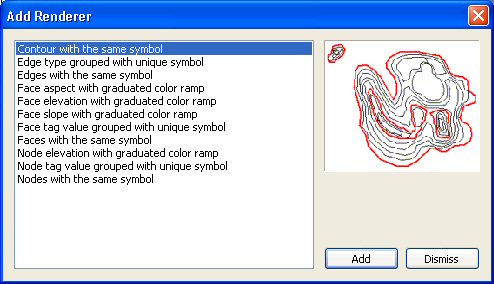
On the Add Renderer menu, select
Contour with the same symbol, then click
Add, and then close the Add
Renderer window.
-
Click on the Contour item box in the
Show window in the upper-left-hand of the
Layer Properties menu and unclick the
Elevation box. Change the Reference
contour height to 100.0, the Contour interval
to 1.0, the Index contour factor to
5, and also change the line colors of
both the Contour symbol and the
Index contour symbol (in this example I
have changed the contour line to light blue
and the index line to a darker blue with
both lines having a
line weight of 1.0) and then click OK.
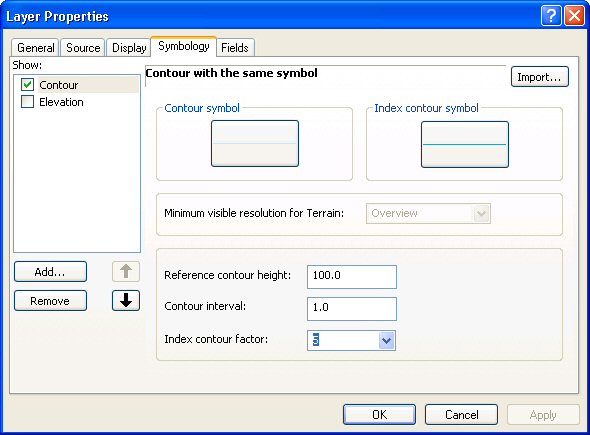
You now have 1-foot contour line
geo-referenced to your site map.
-
To finish your map you should insert labels
for the contour index lines, add a North
arrow, add a scale, and add labels for mahor
streets and buildings.