|
"I am always ready to learn, but I do not always like
being taught." Winston Churchill
Part
1: Solve the following three
problems (you are not required to use an Excel spreadsheet)
Carbon Dioxide Removal #1
-
Groundwater containing 20 mg/l of carbon dioxide
is to be degasified using a multiple-tray aerator with 5 trays. In
this water treatment facility, there are 10 aerators operating in
parallel. For maintenance reasons, only 8 of the aerators are available at
any one time. The design population is 40,000 persons, and the maximum day demand is
150
gal/person-day. The k value is 0.35, and the hydraulic
loading is 4 gpm/ft.2. Determine:
The carbon dioxide content of the product water.
The size of the trays if the length-to-width ratio is
2:1 and the trays are made in 1 in. increments.
Carbon Dioxide Removal #2
-
Groundwater containing 35
mg/l of carbon dioxide is to be degasified using a multiple-tray aerator. The design
population is 150,000 persons, and the maximum day demand is 150 gal/person-day. The
k
value is 0.36, and the hydraulic loading is 3 gpm/ft.2. Determine:
Determine the total number of trays in an aerator required to reduce the carbon
dioxide content of the product water by 90%.
Determine the number of aerators, operated in
parallel, required for the water treatment facility if the size of each
tray is 1,000 ft.2.
Disinfection
|
Time,
seconds |
1 |
2 |
4 |
8 |
|
N/N0
|
3,602/10,000 |
1,303/10,000 |
168/10,000 |
3/10,000 |
Note: A solution to the problems in Part
One will be available after the
due date.
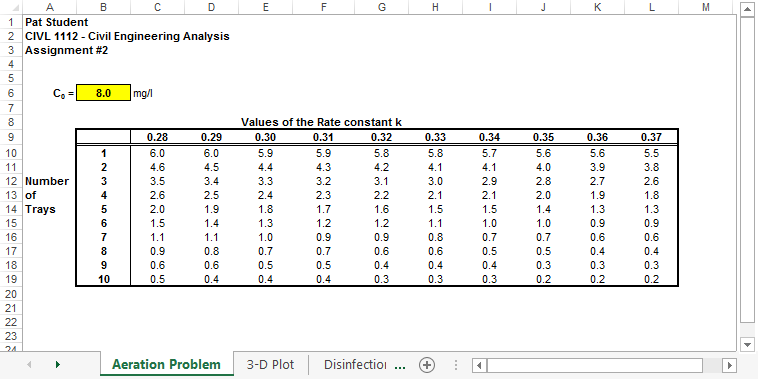
Part 2: Use Excel to develop a table containing the removal of carbon dioxide in a water treatment process using
the aeration model we described in class.

Develop a spreadsheet where the number of aeration trays, n,
varies with the row, and the rate constant, k, varies with the
column. Also, allow the initial effluent concentration to be a parameter in your
calculations. In other words, store the value of C 0
in a cell outside the table.
Click here
for an Excel template spreadsheet for this problem. Your name should appear at the top left,
and the assignment number and date should appear at the top right.

The calculation of the carbon dioxide during aeration involves the use of the Excel EXP()
Function.
Be very careful with your
cell references (relative and absolute cell referencing) when trying to
copy your formula into the table. Pay special attention to which parameters vary
along the row and which vary along the column.
Part 3: Use Excel to
demonstrate the effects of coagulant on effluent turbidity (NTU) as recorded in
the lab.
-
From the jar test
data, plot the supernatant turbidity (NTU) verse the coagulant
dosage. Click
here
for jar test data.
-
Determine the best dosage of coagulant from your
observations and measurements.
-
Using the dosage found in Part b, calculate the quantity
(lb.) of the coagulant needed to treat 20 million gallons per day (MGD).
Part 4. Read the Chapters 3 and 4 in the "A Mind for
Numbers" by Barbara Oakley.
A web page describing the CIVL 1112
Excel Homework
Policy is available. Read it before you turn in each assignment this semester. You
will be graded according to the policy outlined in it.
Coversheet for homework
This website was originally
developed by
Charles Camp for
CIVL
1112.
This site is maintained by the
Department of Civil Engineering
at the University of Memphis.
Your comments and questions are welcomed.
|


